ARP Traffic: Causes, Norms & Diagnostics
28 Aug 2026, 14:01:04
ARP (Address Resolution Protocol) is used in IPv4 networks to determine the MAC address of a device based on its IP address. When a server needs to communicate with a device on the local network, it sends an ARP request and then receives a response containing the MAC address.The presence of ARP traffic on a network interface is normal. A small number of ARP requests are generated regularly during normal server operation, ARP cache updates, communication with the gateway, and interaction with other devices on the network.
An increased amount of ARP traffic may be caused by a large number of devices in the same L2 segment, virtualization, network scanning, configuration errors, or network loops.
How ARP Works
When a server needs to send a packet to another device on the local network, it needs to know the recipient's MAC address.For example, the server wants to communicate with:
192.168.1.10
But the MAC address of this device is unknown. The server therefore sends an ARP request:
Who has 192.168.1.1?
Who has 192.168.1.2?
Who has 192.168.1.3?
...
Tell 192.168.1.5
The device with the IP address 192.168.1.10 responds:
192.168.1.10 is at AA:BB:CC:DD:EE:FF
The obtained MAC address is stored in the ARP cache, so the server normally does not need to perform an ARP request for every packet.
Why ARP Traffic Appears on a Network Interface
ARP traffic can appear for several reasons:- the server communicates with new IP addresses within the local segment;
- ARP cache entries expire;
- there are many devices in the same L2 segment;
- virtual machines and containers are running;
- network checks and monitoring are being performed;
- a device's MAC address has changed;
- the network interface has been restarted;
- the network configuration has changed;
- DHCP is operating;
- there are problems with the ARP cache or network infrastructure.
How to Monitor ARP Traffic
You can use tcpdump to monitor ARP packets.For example:
tcpdump -ni eth0 arpIf the interface is called ens18:tcpdump -ni ens18 arp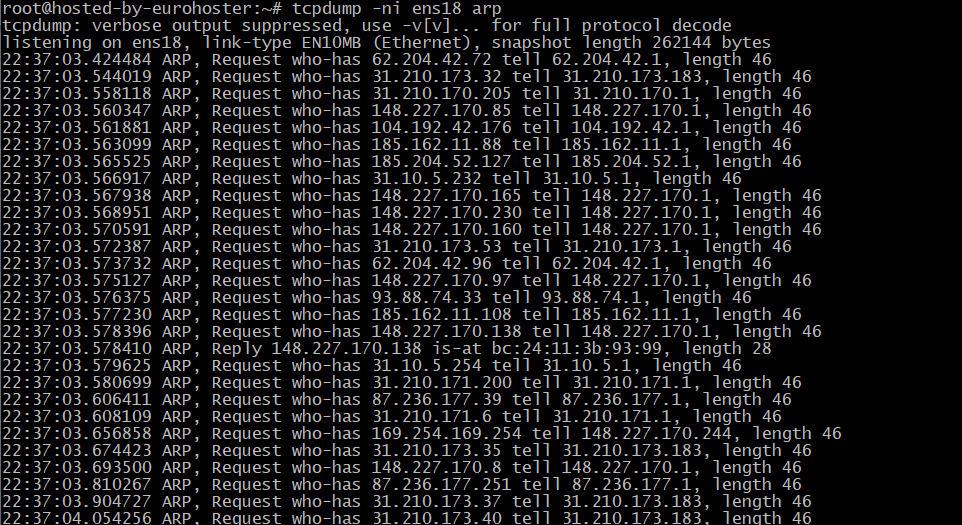
For more detailed output:
tcpdump -ni ens18 -vv arp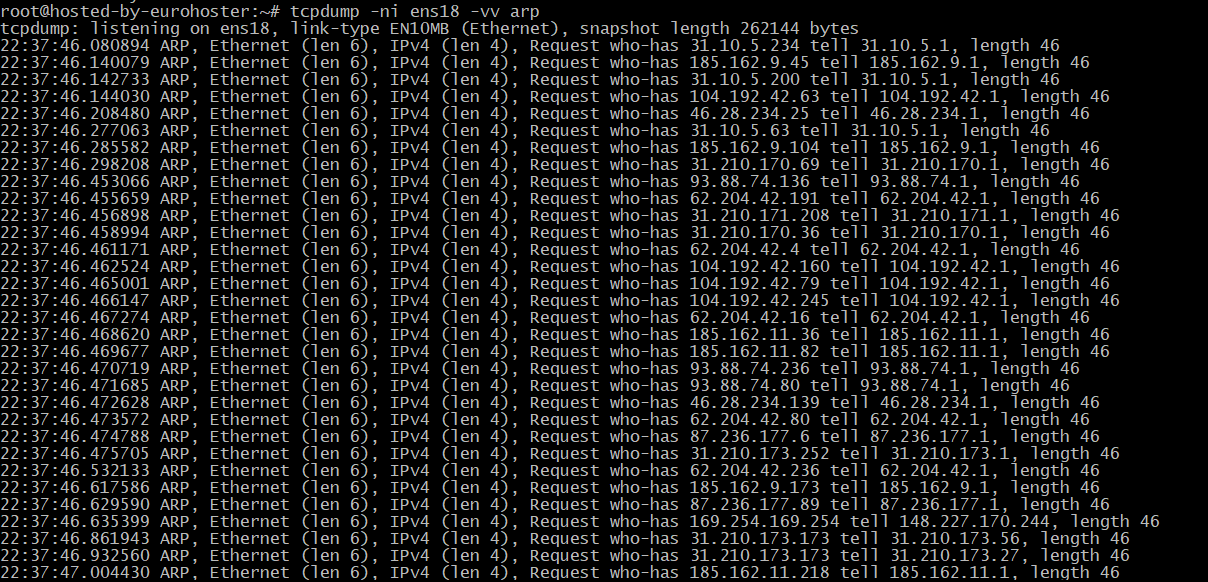
Checking the ARP Cache
Current ARP entries can be viewed using:ip neigh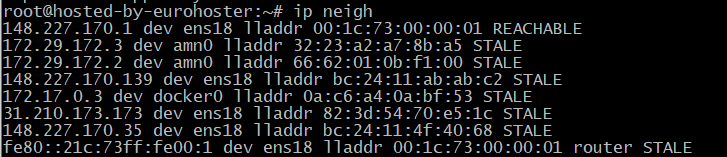
Common states include:
- REACHABLE — the device was recently reachable;
- STALE — the entry exists but has not been confirmed recently;
- DELAY — confirmation of the device's reachability is pending;
- PROBE — the device is being actively checked;
- FAILED — the device could not be reached or resolved.
When a Large Amount of ARP Traffic Can Be a Problem
A small amount of ARP traffic usually has no noticeable impact on server performance.A problem may occur when an abnormally large number of ARP packets are observed, for example thousands or tens of thousands of packets per second.
1. Large L2 segment
A large number of devices are located within the same broadcast domain.
2. ARP scan
A device may be scanning a range of IP addresses:
Who has 192.168.1.1?
Who has 192.168.1.2?
Who has 192.168.1.3?
...
3. Network loop
Errors in the L2 configuration can result in a significant increase in broadcast traffic.
4. Virtualization issues
A large number of VPSs/VMs connected to the same bridge or vSwitch can generate significant ARP/broadcast traffic.
5. ARP cache issues
If ARP entries are constantly being removed or are not being retained, devices may have to perform ARP requests more frequently.
6. Incorrect network configuration
For example, problems with VLANs, bridges, gateways, or network masks.
ARP and CPU Load
ARP traffic itself is generally not a cause of high CPU utilization.However, when there is a very large number of ARP packets, processing them can create additional load on:
- the Linux network stack;
- CPU;
- virtual switch;
- bridge;
- firewall;
- conntrack;
- hypervisor.
For example, several dozen ARP packets per second normally do not cause any problems. A completely different situation is thousands or tens of thousands of ARP requests per second.
How to Determine the Source of ARP Traffic
For troubleshooting, you can use:tcpdump -ni eth0 arpTo display only ARP requests:tcpdump -ni eth0 'arp[6:2] = 1'To display ARP replies:tcpdump -ni eth0 'arp[6:2] = 2'You can also save the traffic for further analysis in Wireshark:tcpdump -ni eth0 -w arp.pcap arpAfter running this command, tcpdump will capture all ARP traffic from the eth0 interface and save it to the arp.pcap file.Let it run for approximately 60 seconds, then press Ctrl+C.

After that, the resulting statistics can be used to analyze the traffic.
The arp.pcap file can then be opened in Wireshark to determine:
- which devices are sending ARP requests;
- which IP addresses are being queried;
- which MAC addresses are responding;
- how frequently the requests are being sent;
- whether there is any unusual activity.
Conclusion
ARP traffic is a normal part of IPv4 network operation. The presence of ARP packets on a network interface by itself does not indicate a problem.During troubleshooting, you should evaluate:
- the number of ARP packets per second;
- the ratio of requests to replies;
- the IP addresses being queried;
- the MAC addresses of the senders;
- the state of the ARP cache;
- the presence of VLANs, bridges, or vSwitches;
- the number of virtual machines in the segment;
- the presence of network scanning or L2 loops.