How to Analyze Linux Server Load Using SAR
13 Sep 2026, 14:05:53
SAR (System Activity Reporter) is a utility from the sysstat package designed to monitor and analyze Linux server performance. It can be used to monitor CPU usage, RAM and SWAP utilization, disk activity, network traffic, system load, and other performance metrics.The main advantage of SAR is that it allows you to analyze not only the current state of a server but also historical performance data from previous hours or days.
Installation
On Debian/Ubuntu:apt install sysstatOn RHEL/CentOS/AlmaLinux/Rocky:dnf install sysstatAfter installation, you need to enable statistics collection:systemctl enable --now sysstatHistorical data is usually stored in:/var/log/sa/
For example:
/var/log/sa/sa13 — the statistics file for the 13th day of the month.
Main SAR Command
If you run:sarthe command will display basic CPU statistics for the current day.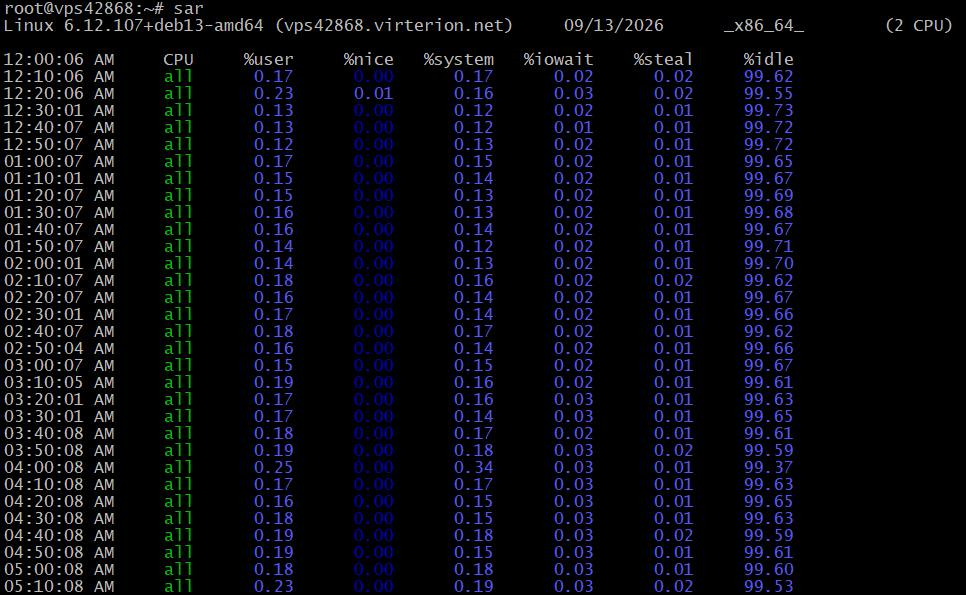
To view all available statistics, use:
sar -AHowever, in practice, it is more convenient to check individual subsystems.1. CPU Usage
sar -uTo monitor CPU usage in real time:sar -u 1 10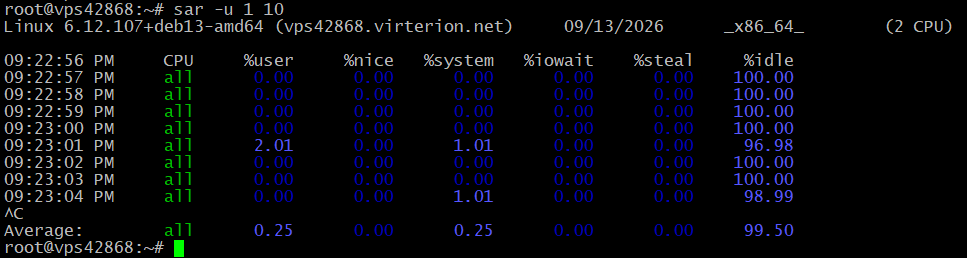
The command collects data every second and performs 10 measurements.
Main metrics:
- %user — CPU time spent running user processes;
- %system — CPU time spent running kernel processes;
- %iowait — time the CPU spends waiting for input/output operations;
- %steal — CPU time taken away from the virtual machine by the hypervisor;
- %idle — percentage of time the CPU is idle.
High %iowait is often associated with high disk load or disk performance issues. For VPSs, it is also important to monitor %steal: high values may indicate CPU contention on the physical host.
To view statistics for each CPU separately:
sar -P ALL2. RAM and SWAP
sar -r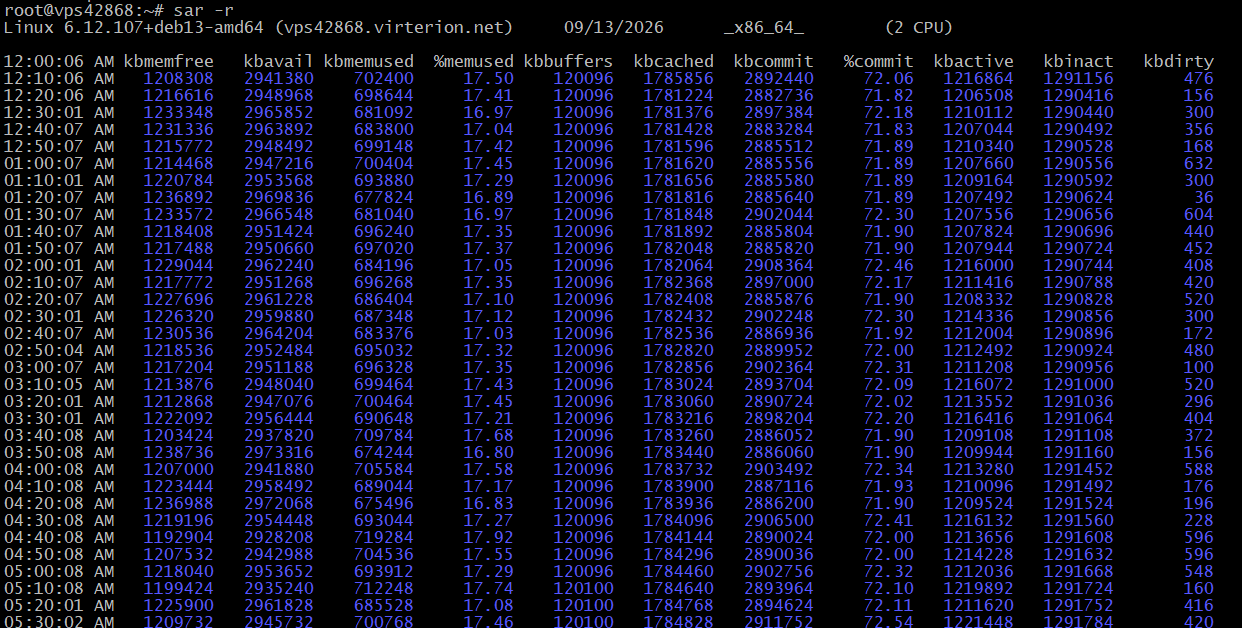
This command shows RAM usage.
Main metrics:
- kbmemfree — amount of free memory;
- kbmemused — amount of used memory;
- %memused — percentage of used RAM;
- kbcached — amount of memory used for caching;
- kbcommit — amount of memory required for currently allocated processes.
sar -SIf the server is actively using SWAP, this may indicate insufficient RAM. However, the mere presence of used SWAP does not necessarily indicate a problem — the intensity of memory swapping is more important.3. Disk Activity
To view disk statistics:sar -d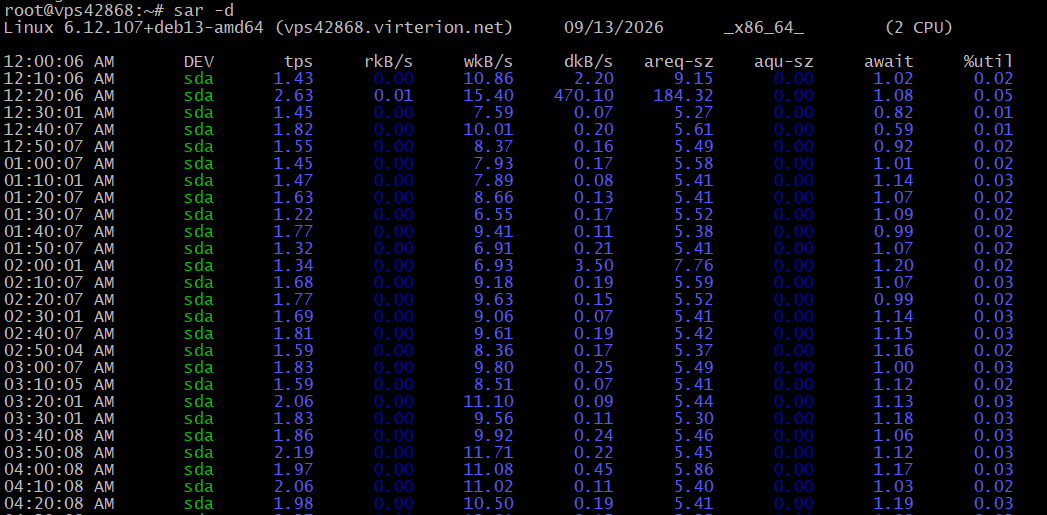
You can use it to evaluate the number of I/O operations, the amount of transferred data, and the average time required to complete operations.
For a more detailed analysis of the disk subsystem, you can additionally use:
iostat -xzSAR helps identify performance trends over time, while iostat provides more detailed information about individual disks.4. Paging and Virtual Memory
The command:sar -B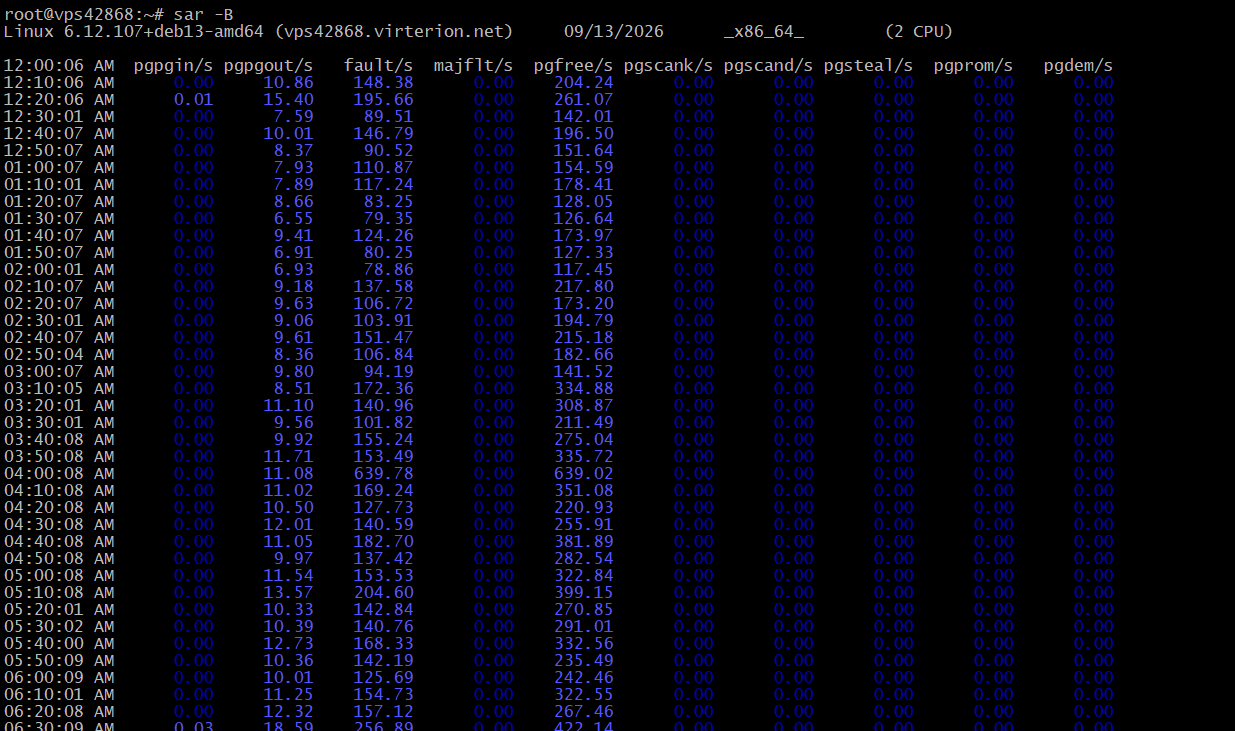
shows statistics related to virtual memory and paging.
It is especially useful when diagnosing:
- insufficient RAM;
- intensive SWAP usage;
- increased memory page activity;
- situations where the system starts actively moving data between RAM and disk.
5. Network Load
To view network traffic:sar -n DEV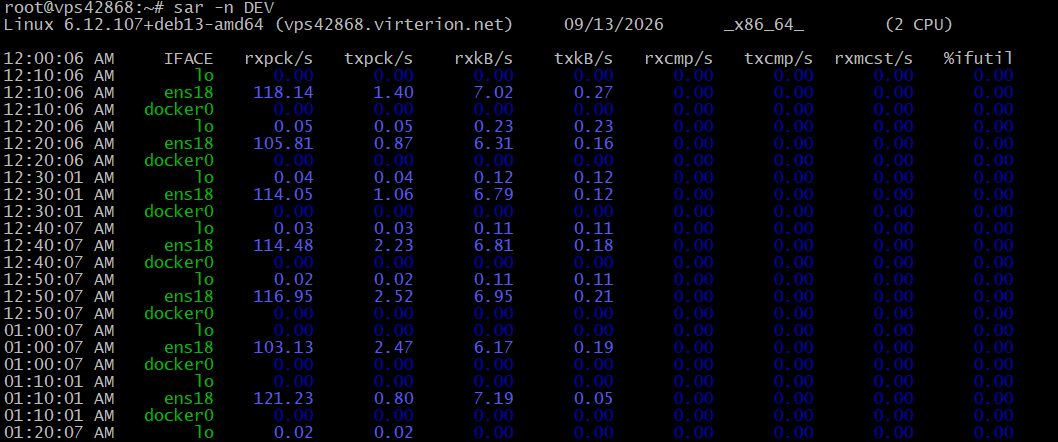
This shows the number of received and transmitted packets and the amount of data transferred through each network interface.
For example, this allows you to determine which interface is generating the most traffic.
To check network errors:
sar -n EDEVThis can be used to check errors and dropped packets.6. Load Average
sar -qThis command shows information about the process queue and Load Average.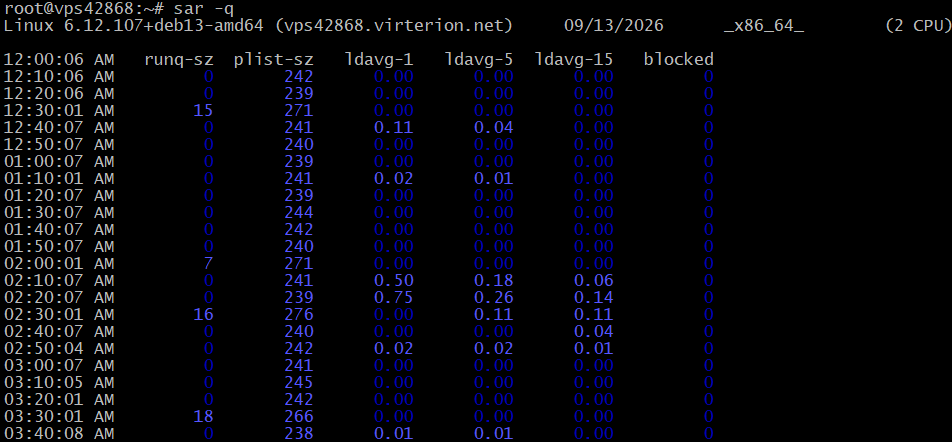
Load Average represents the number of tasks that are either running or waiting for CPU or other system resources.
For example, on a server with 2 CPUs:
- Load around 1 — usually indicates a relatively low load, with some CPU capacity still available;
- Load around 2 — the CPUs are, on average, fully utilized;
- Load significantly above 2 — some tasks are waiting for CPU time or other resources.
7. Historical Analysis
One of the main advantages of SAR is the ability to see what was happening on the server in the past.For example:
sar -f /var/log/sysstat/sa12This displays statistics for the 12th day of the month.You can limit the time range:
sar -f /var/log/sysstat/sa12 -s 10:00:00 -e 12:00:00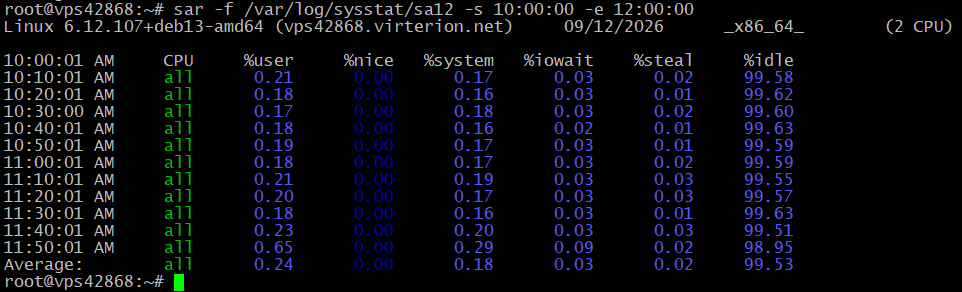
This is especially useful if a problem occurred several hours ago and the server is currently operating normally.
For example, after a customer reports that a website was slow, you can check whether there was high CPU usage, increased disk activity, insufficient memory, or network problems at that particular time.
8. Practical Troubleshooting Workflow
When diagnosing high server load, it is convenient to start with the overall system state:sar -u
sar -r
sar -qIf a disk-related issue is suspected:sar -d
sar -B
iostat -xzIf the problem is related to the network:sar -n DEV
sar -n EDEV
sar -n TCPIf insufficient memory is suspected:sar -r
sar -S
sar -Wjournalctl, ss, iostat, mpstat, pidstat, and tcpdump can be used additionally when SAR shows an abnormality and you need to identify the specific cause.Conclusion
SAR is one of the most useful tools for analyzing Linux server performance. It helps determine which resource was overloaded and when exactly the problem occurred.For basic troubleshooting, it is enough to remember a few commands:
sar -u      # CPU

sar -r      # RAM

sar -S      # SWAP

sar -d      # disks

sar -n DEV     # network

sar -q      # Load Average

sar -W      # paging/SWAP

sar -f      # historical data

sar -A      # all available statistics
During troubleshooting, it is important not to analyze a single metric in isolation. For example, a high Load Average combined with high %iowait may indicate a disk-related problem, while high %user with low %iowait is more likely to indicate high application-level CPU usage.