How to Analyze Linux Server Logs Using journalctl
12 Sep 2026, 14:21:36
When troubleshooting a Linux server — such as an unexpected reboot, service failure, SSH issues, high system load, or network problems — journalctl is one of the first diagnostic tools to use.journalctl allows you to view the systemd journal, filter log entries by time, service, and severity level, and analyze kernel-related events.
1. Basic Commands
Last entries:journalctl -n 100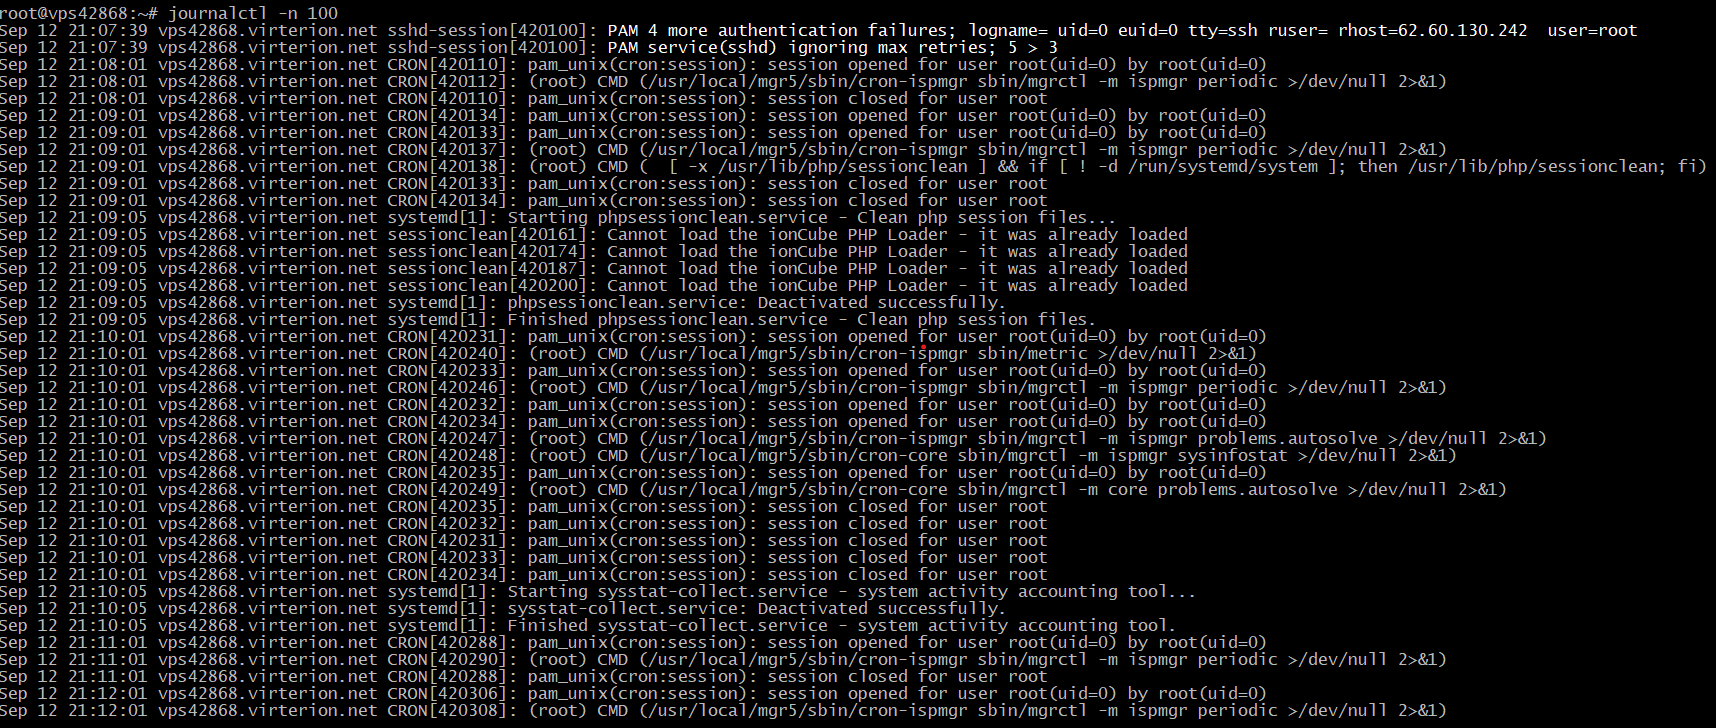
Follow new messages in real time:
journalctl -fCurrent boot:journalctl -bPrevious boot:journalctl -b -1List available boots:journalctl --list-boots
Errors from the current boot:
journalctl -b -p err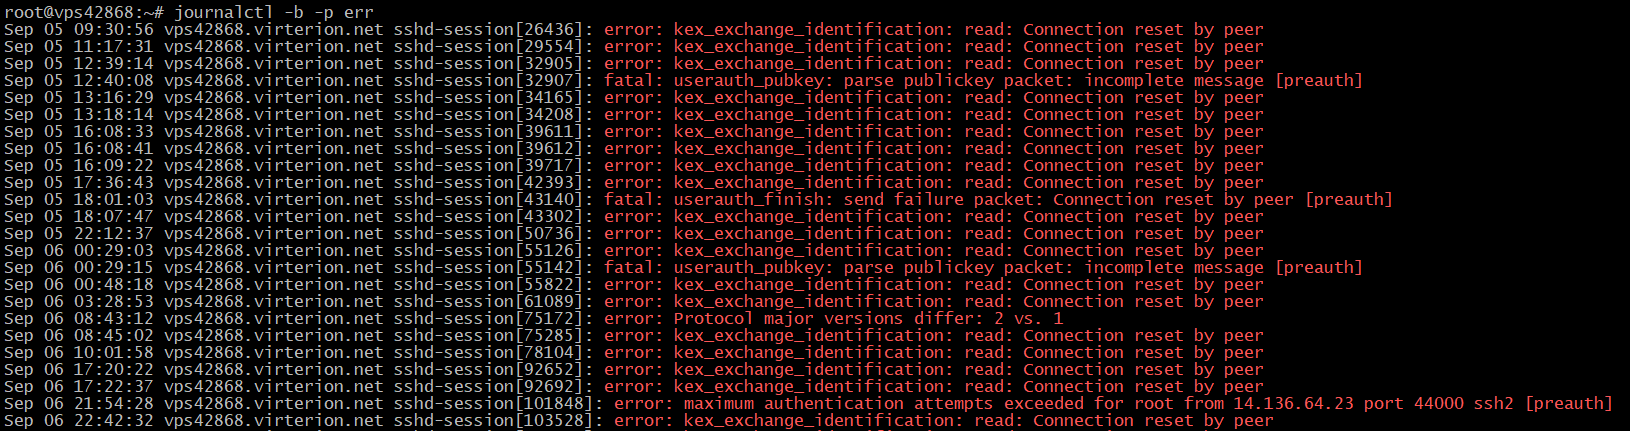
Kernel messages:
journalctl -k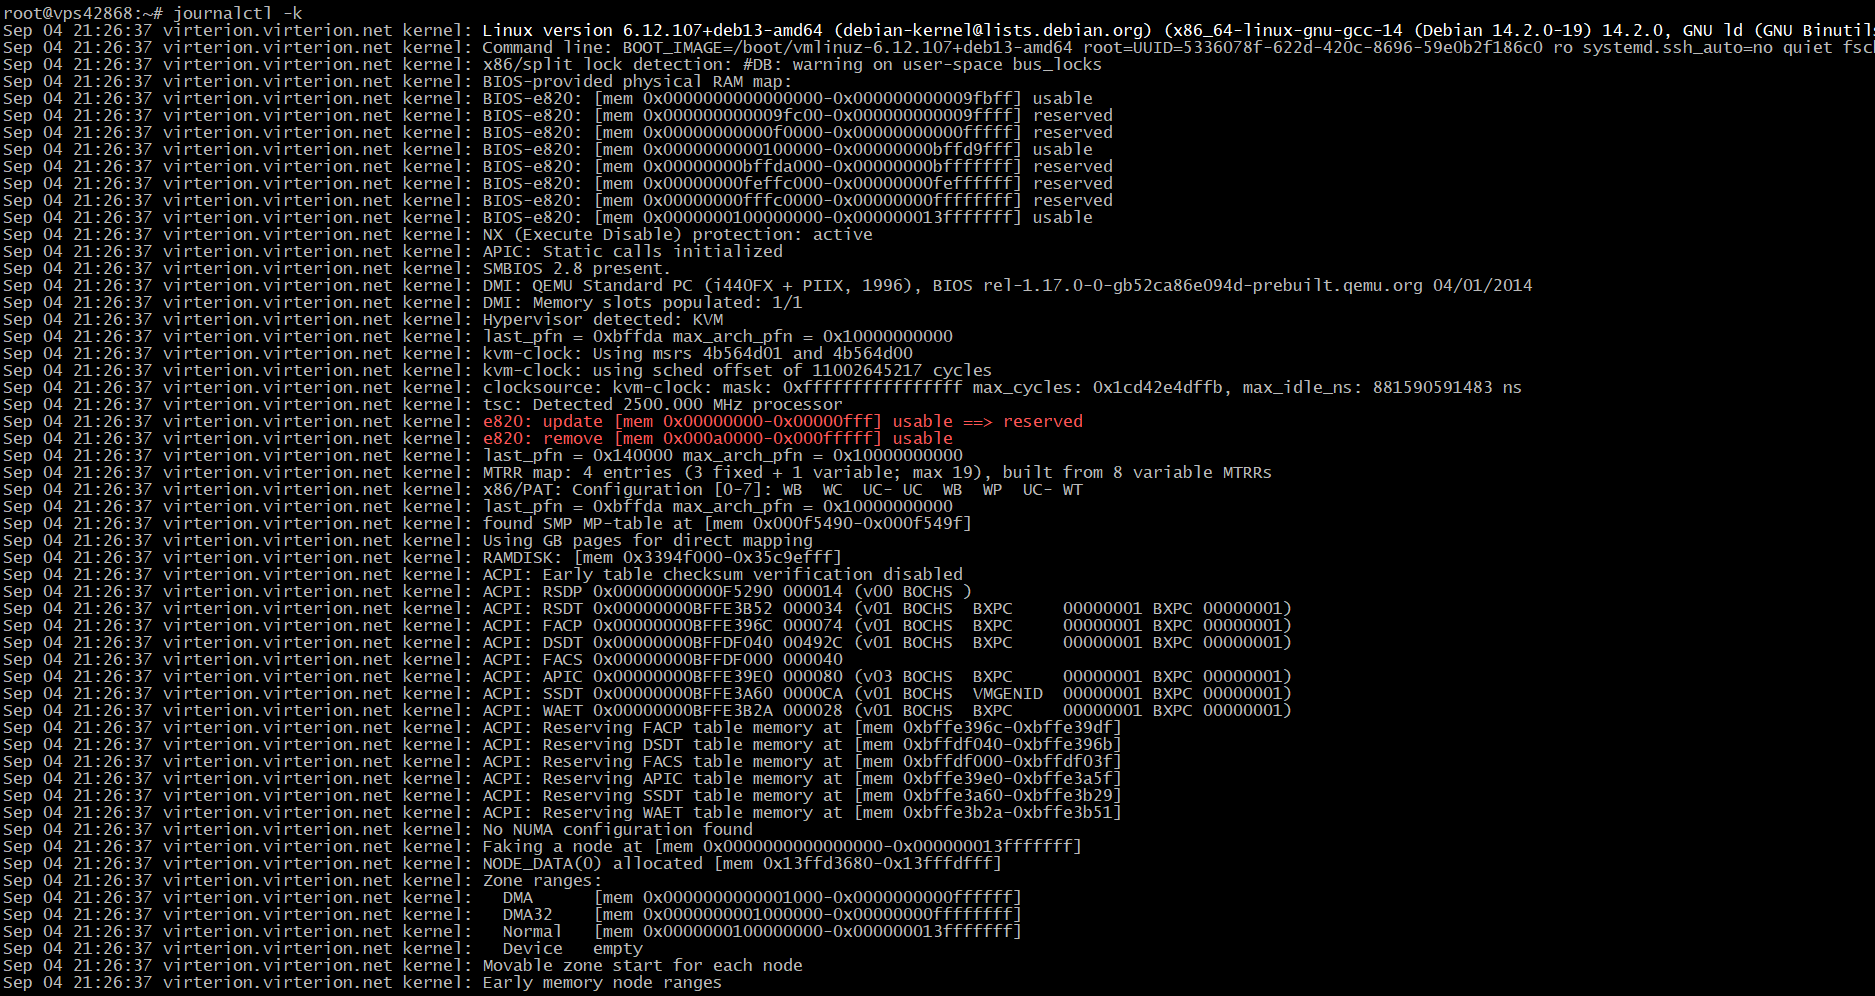
Errors and warnings:
journalctl -p warningJournal priority levels:- 0 — emergency
- 1 — alert
- 2 — critical
- 3 — error
- 4 — warning
- 5 — notice
- 6 — info
- 7 — debug
2. Filtering by Time
When troubleshooting, it is better to limit the search to the time period when the problem occurred.journalctl --since "2026-09-12 10:00:00" --until "2026-09-12 11:00:00"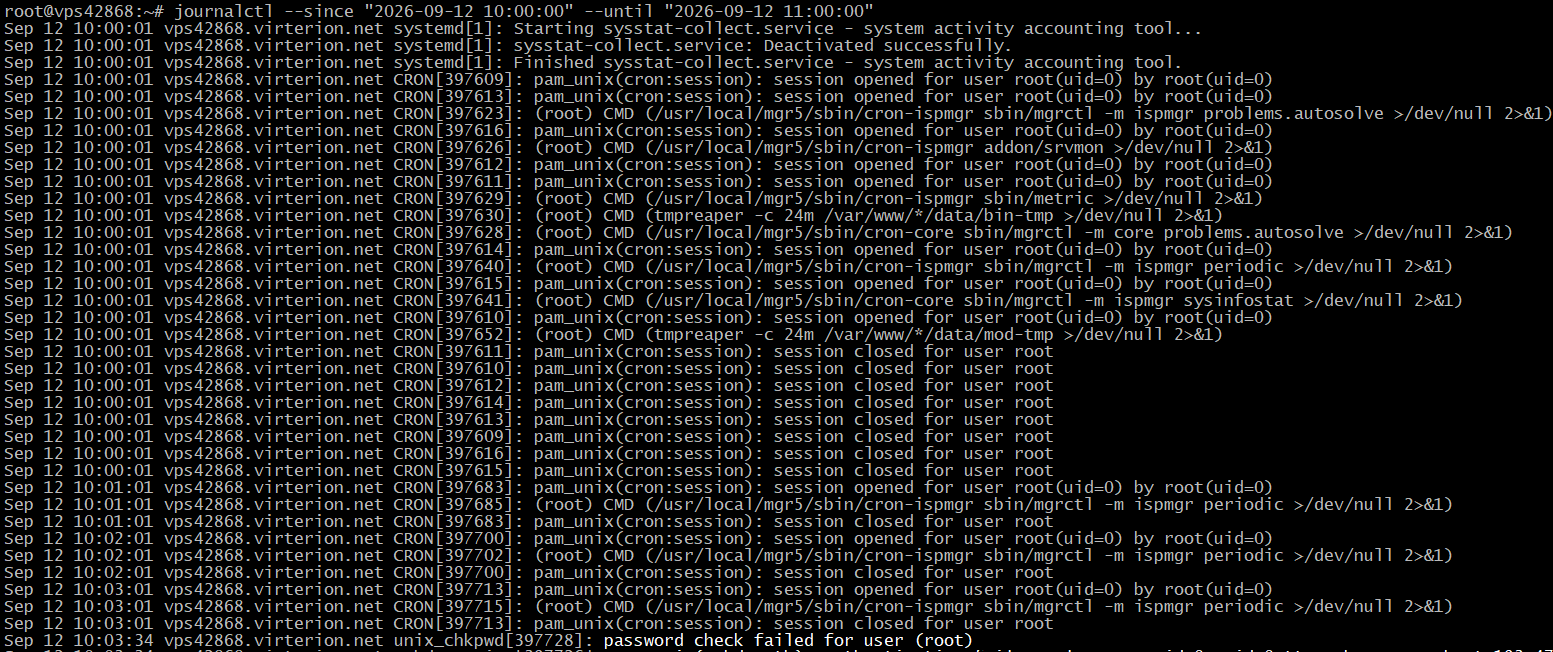
Last hour:
journalctl --since "1 hour ago"Last 30 minutes:journalctl --since "30 minutes ago"Today's messages:journalctl --since todayThis is especially important when dealing with a large volume of logs.3. Analyzing a Specific Service
Use -u to search the logs of a specific service.For example, Nginx:
journalctl -u nginxLast 100 messages:journalctl -u nginx -n 100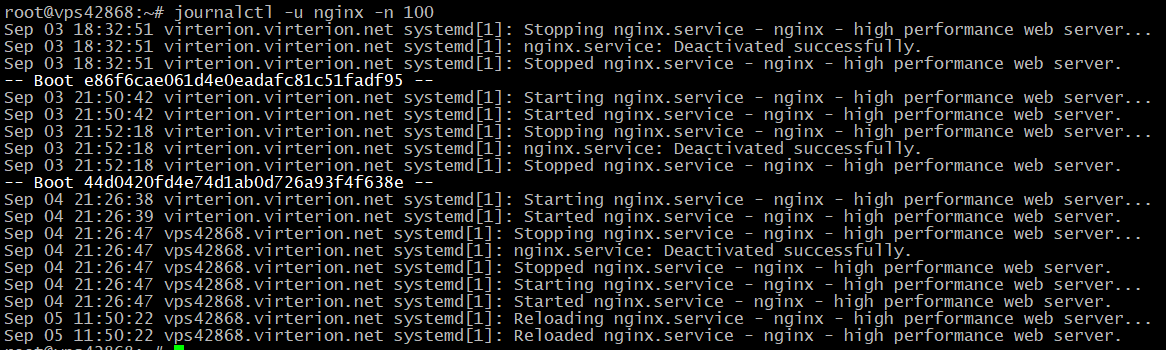
Last hour:
journalctl -u nginx --since "1 hour ago"In real time:journalctl -u nginx -fFor SSH, the unit name depends on the distribution:journalctl -u ssh
journalctl -u sshdYou can also check:systemctl status nginx
systemctl --failedIf a service is in the failed state, its journal is usually the first place to look for the cause.4. Analyzing SSH
When troubleshooting SSH connections:journalctl -u ssh --since "1 hour ago"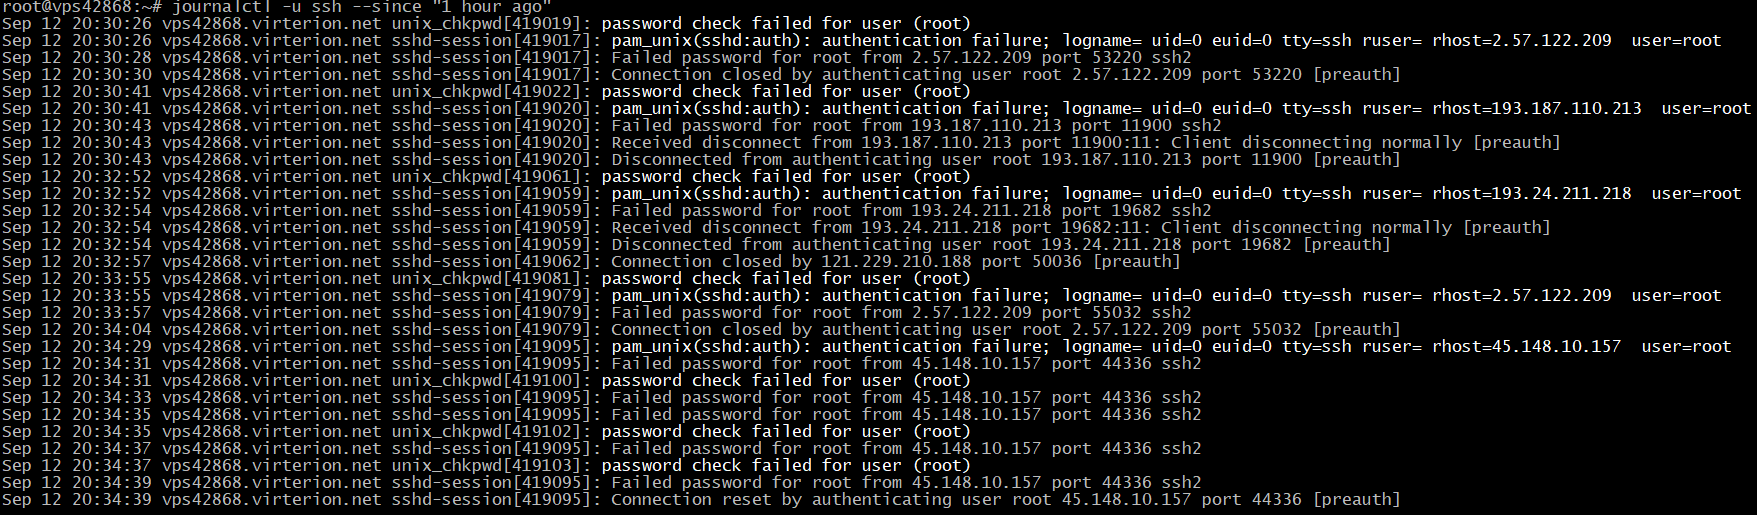
or:
journalctl -u sshd --since "1 hour ago"To search for authentication errors:journalctl -u ssh | grep -Ei "failed|authentication|invalid"The journal can reveal failed login attempts, key-related issues, incorrect passwords, and configuration errors.At the same time, some systems store additional authentication information in /var/log/auth.log or /var/log/secure.
5. Analyzing an Unexpected Reboot
If the server unexpectedly rebooted, first identify the previous boot:journalctl --list-bootsThen view the end of the previous session:journalctl -b -1 -eAnd check kernel messages:journalctl -k -b -1Pay particular attention to:oom
panic
watchdog
I/O error
segfault
failed
error
If there is no obvious cause in the journal, additional checks should be performed using hardware logs, RAID information, IPMI/iDRAC/iLO, and other available sources.
6. Searching for the OOM Killer
When the system runs out of memory, Linux may forcibly terminate processes using the OOM Killer.Search the journal:
journalctl -k | grep -Ei "oom|out of memory|killed process"After detecting an OOM event, check the available memory:free -hAnd find the processes consuming the most RAM:ps aux --sort=-%mem | head -20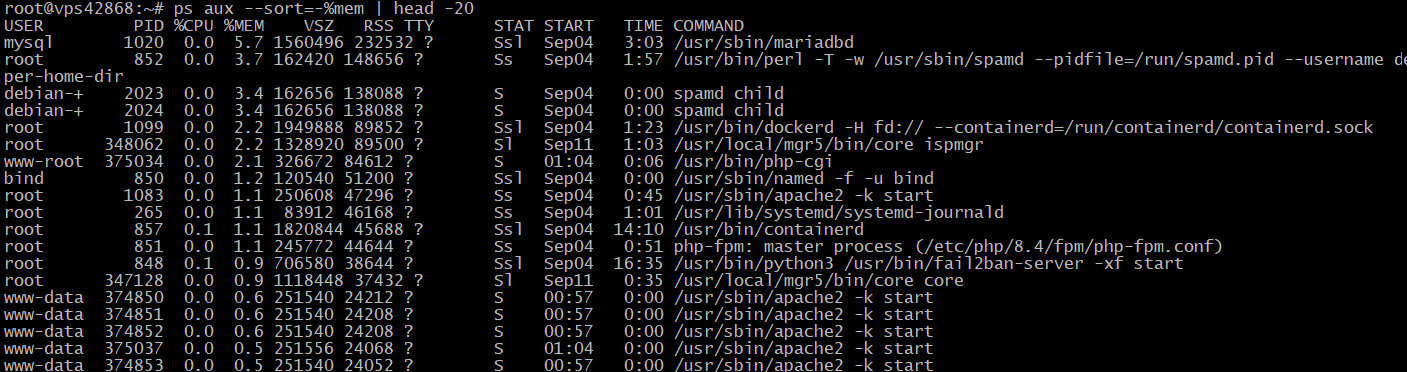
journalctl helps determine whether an OOM event occurred, while additional commands can help identify the cause of the memory shortage.
7. Analyzing Disks and the File System
Kernel messages related to disk problems:journalctl -k | grep -Ei "I/O error|read error|write error|nvme|ata|ext4|xfs"For RAID, you can additionally search for:journalctl -k | grep -Ei "raid|md[0-9]|degrad"However, journalctl does not replace hardware diagnostics. If a disk failure is suspected, use smartctl, while for hardware RAID, use the appropriate RAID controller tools.8. Analyzing Network Problems
Kernel and network service messages:journalctl -k | grep -Ei "network|link|eth|ens|eno|net"For NetworkManager:journalctl -u NetworkManagerFor systemd-networkd:journalctl -u systemd-networkdYou may find events such as:Link is Down
Link is Up
However, journalctl does not show the complete route of network traffic. Further diagnostics can be performed using:
ip -s link

ip route

ping

mtr

ss

tcpdump
9. Searching for Specific Messages
You can use grep to search for specific text:journalctl -b | grep -i "error"Memory:journalctl -b | grep -Ei "oom|out of memory|killed process"Disks:journalctl -k | grep -Ei "I/O error|nvme|ata|ext4|xfs"Network:journalctl -k | grep -Ei "link is down|network|timeout"The journal can also be filtered by PID or process name:journalctl _PID=1234
journalctl _COMM=nginx10. Output Format
For a more convenient date and time format:journalctl -o short-iso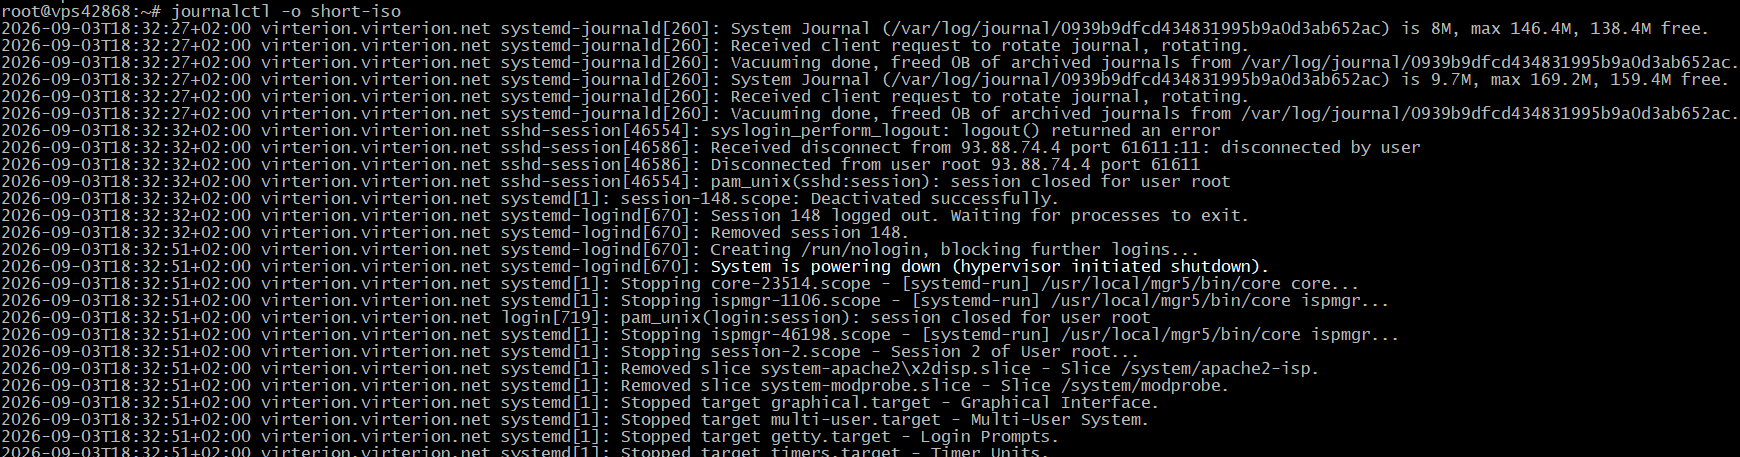
Display only the message text:
journalctl -o cat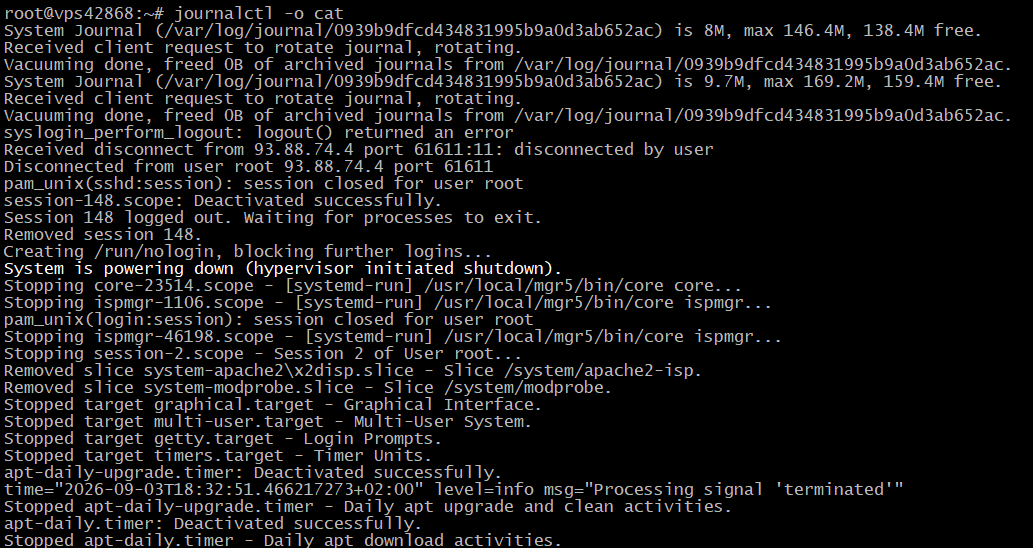
JSON:
journalctl -o jsonFor routine troubleshooting, the default format or short-iso is usually sufficient.11. If the Journal Takes Up Too Much Space
Check the journal size:journalctl --disk-usage
View the storage configuration:
cat /etc/systemd/journald.conf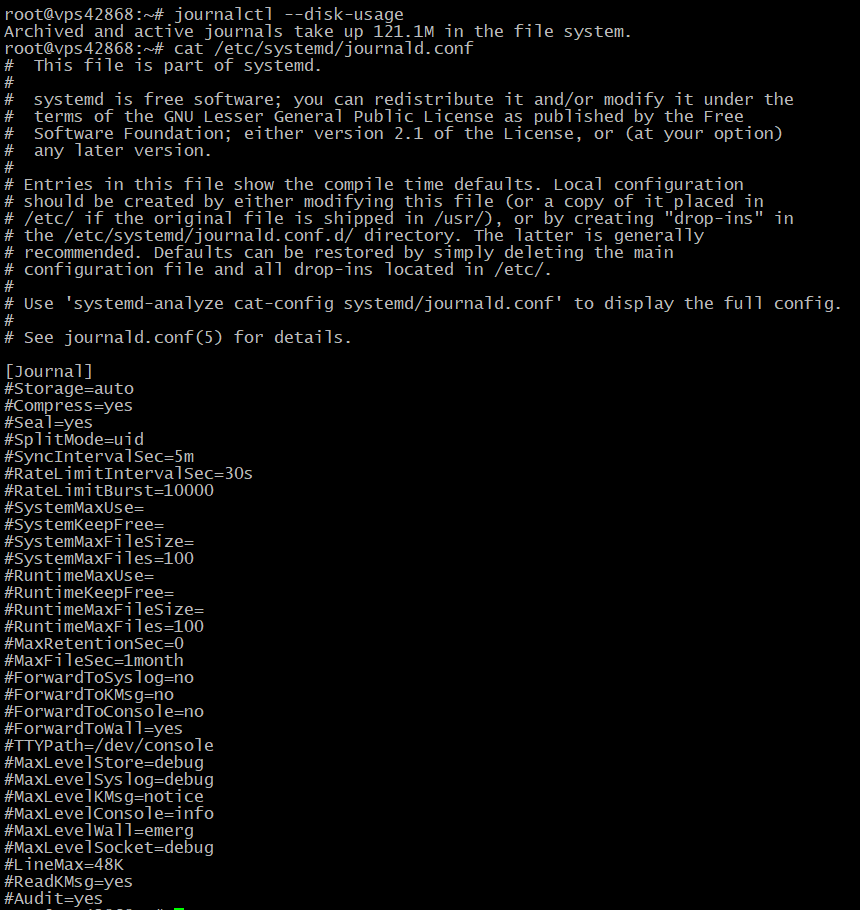
Main parameters:
SystemMaxUse=
SystemKeepFree=
MaxRetentionSec=
After changing the configuration:
systemctl restart systemd-journaldDo not clear or restrict the journal until the investigation is complete if older log entries may still be required.12. Do Not Rely on journalctl Alone
Not all applications write their messages directly to the systemd journal. Some services use their own log files in /var/log/.For example:
/var/log/syslog
/var/log/messages
/var/log/auth.log
/var/log/nginx/
/var/log/apache2/
Therefore, during an investigation, you should check both journalctl and the logs of the specific application.
Useful Commands
| Task | Command |
|---|---|
| Last 100 entries | journalctl -n 100 |
| Follow new messages in real time | journalctl -f |
| Current boot | journalctl -b |
| Previous boot | journalctl -b -1 |
| Errors | journalctl -b -p err |
| Kernel logs | journalctl -k |
| List boots | journalctl --list-boots |
| Service logs | journalctl -u nginx |
| Service logs for the last hour | journalctl -u nginx --since "1 hour ago" |
| Failed services | systemctl --failed |
| Journal size | journalctl --disk-usage |
| Search by text | journalctl -b | grep -i "error" |
Conclusion
journalctl is one of the key tools for troubleshooting Linux servers. It helps determine what happened, when it happened, and which system component was affected.The most effective approach is:
problem → event time → journalctl → service/kernel → root cause → further diagnostics
For a complete investigation, journalctl should be used together with systemctl, dmesg, top, free, iostat, ss, ip, mtr, tcpdump, and the logs of specific applications.